SIP Briefing slides
Refer to the slides below for more information on 'The Scientific Method'.
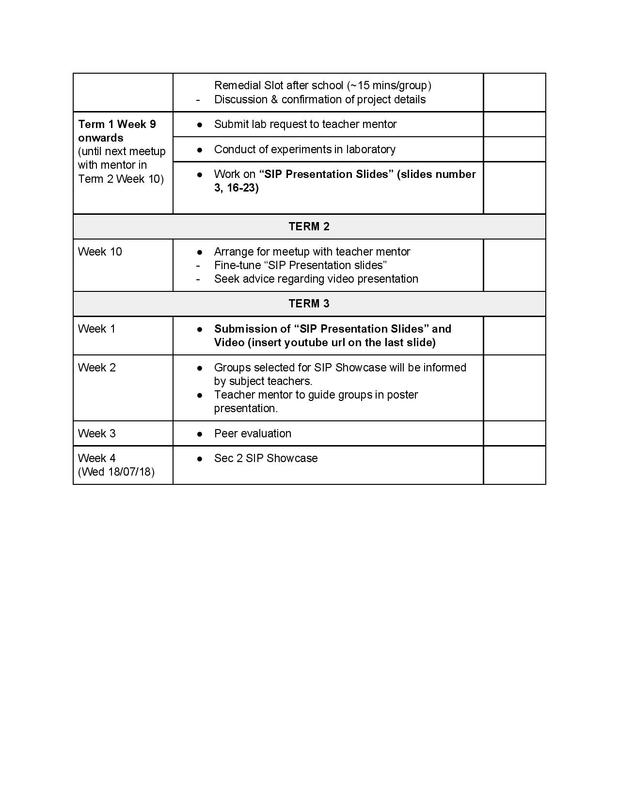
SIP Timeline
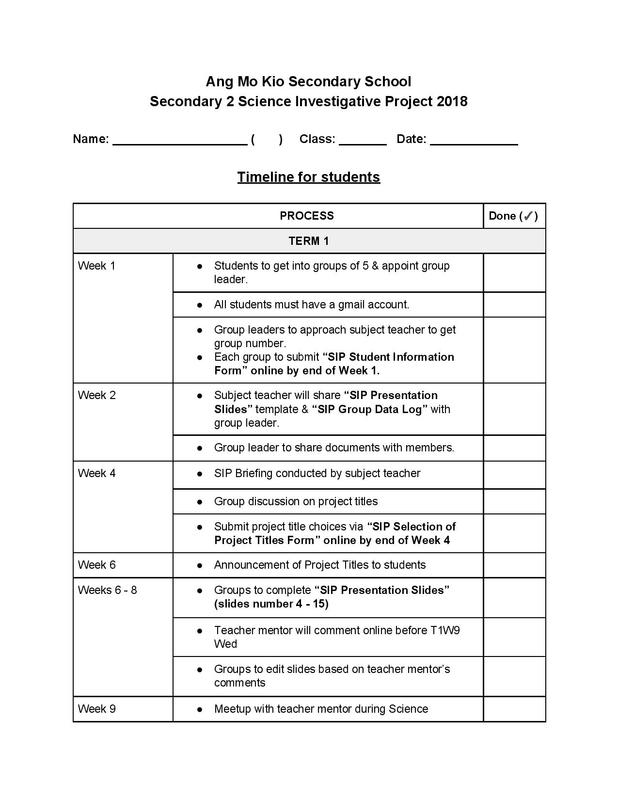
Stage 1: Planning & research
To help you in your planning process, download the file below to access the URL next to your allocated project titles. These webpages offer suggestions on ways to research and conduct your experiments.
| list_of_suggested_project_titles.docx |
Your group should already have access to the Google drive folder (eg: 21 Group1).
Complete slides 4 - 15 of the 'SIP Presentation Slides' by Term 1 Week 8 Wednesday.
Your teacher mentor will comment online before the meetup in Term 1 Week 9 Wednesday.
Complete slides 4 - 15 of the 'SIP Presentation Slides' by Term 1 Week 8 Wednesday.
Your teacher mentor will comment online before the meetup in Term 1 Week 9 Wednesday.
Stage 2: Teacher mentor meetup with groups
ALL students to report (compulsory session).
Date/Day: 28 February 2018, Wednesday
Time: 2:30 - 3:30 pm
Venue: Respective classrooms (your Science teacher will inform you on the venue)
After this session, students are to submit their laboratory request form and arrange with their mentors on when to conduct their experiments in the Science laboratory.
Stage 3: Conducting Experiments & Data Collection
In your Google drive folder, there is a document titled 'Group Data Log'.
This data log serves as a working document for your group to record your drafts, raw data, photos etc. once you start on your experiments. It also contains the rubrics of the graded components.
This data log serves as a working document for your group to record your drafts, raw data, photos etc. once you start on your experiments. It also contains the rubrics of the graded components.
Data Collection
Data collection can be done either quantitatively -- that is, using numerical measurements such as height and weight, or qualitatively, or descriptions such as "light-coloured" or "dark-coloured."
MEASURE IT
Quantitative measurements record changes in the experiment in numerical form. For example, measuring the speed of a solar-powered car, yields a good idea about the strength of different batteries that are being tested. Quantitative measures allow you to calculate the inaccuracy of repeated measurements or repeated experiments -- known as the percent error. It also allows for statistical analysis that tells you whether the results were derived from more than just random chance.
DESCRIBE IT
Qualitative measures partition results into descriptive categories. For example, a chemical reaction produces a liquid that can be described as clear, pink or red. Qualitative measures can be done more easily than quantitative measures but provide less information. A method of data collection called semi-quantitative measurements, however, are qualitative measures that are repeated multiple times. For example, even though "clear," "pink" and "red" are not numbers, three repeated experiments might all yield approximately 10/100 (10 percent) clear and 90/100 (90 percent) red liquid -- suggesting that the experiment reliably yields 90 percent red liquid every time. Semi-quantitative analysis quantifies a qualitative measure, allowing the researcher to apply statistical tests to determine if the effect is real or just due to random chance.
HAVE TRIPLICATES & REPEATS
Each condition being tested should have triplicates, meaning each treatment group should have at least three samples. For example, if you're testing the effect of sunlight on the growth of potatoes, the sunlight-treated group and the kept-in-the-dark group should each have more than one potato. This prevents unforeseen problems. For instance, if there is only one potato and it happens to be rotten or accidentally eaten by your pet dog, your several-week-long experiment will be destroyed. Furthermore, if you have two, three or more potatoes in each treatment group, you do not have to worry about natural differences in the growth rate of individual potatoes skewing the effect of sunlight. Lastly, repeat the experiment at least twice to see if you get the same results, and organize your data in the format of a data table.
H., David. (n.d.). How to Collect Data From a Science Project. Synonym. Retrieved from http://classroom.synonym.com/collect-data-science-project-14591.html
Guidelines for making a data table
| guidelines_for_making_a_data_table.pdf |
Seniors' work for reference
As your group embark on the experiments, you should take photos & videos and upload them into your data log for record purposes. To view your seniors' work for reference, please click on the button below to access the Youtube channel.
Stage 4: Analysis of Findings
Stage 5: Conclusion
Stage 6: Presentation & submission of project
Deadline: 29 June 2018, Friday [online Gdrive submission]
How do I create an unlisted Youtube video?
An unlisted video is a different type of private video. "Unlisted" means that only people who know the link to the video can view it (only teachers whom have access to the link). An unlisted video will not appear in any of YouTube's public spaces (such as search results, your channel, or the Browse page).
You can choose to make any of your uploads an unlisted video in your YouTube Account settings. Here’s how:
- The video is a record of your group's oral presentation of your Powerpoint slides.
- All members must be present and have a part to say.
- You may insert in video clips of the experimental process.
- Duration of video: 3 - 5 mins.
For more details on rubrics, please refer to your Group Data Log.
Remember to insert your video LINK on the last slide of your Powerpoint presentation.
You can choose to make any of your uploads an unlisted video in your YouTube Account settings. Here’s how:
- Sign into your YouTube Account
- Go to your My Videos page
- Select the video which you’d like to make an unlisted video. Click the Edit button to access the video’s settings.
- Go to the Privacy section of the page. There you’ll see the option to mark you video as “unlisted”, “public”, or “private”. Select unlisted.
- Don’t forget to click the Save Changes button. Once you’ve done this your video will be an unlisted video.
- The video is a record of your group's oral presentation of your Powerpoint slides.
- All members must be present and have a part to say.
- You may insert in video clips of the experimental process.
- Duration of video: 3 - 5 mins.
For more details on rubrics, please refer to your Group Data Log.
Remember to insert your video LINK on the last slide of your Powerpoint presentation.
Photo used under Creative Commons from Ben Taylor55
